Introduction
- Quality control of clinical biochemistry laboratory healthcare ka ek essential hissa hai, jo medical decision-making ko influence karne wale critical data provide karta hai.
- Biological samples jaise blood, urine, cerebrospinal fluid, aur dusre body fluids ka analysis karke, clinical biochemistry humare body ke metabolic, biochemical, aur enzymatic functions ke baare mein insight deta hai.
- Yeh laboratory wide range ke tests perform karti hai jo organ function, disease progression, aur metabolism ya nutrition mein abnormalities ko assess karte hain.
- Clinical biochemistry laboratory ka importance bohot zyada hai, kyunki yeh biochemical markers ko analyze karke conditions jaise diabetes, kidney disease, liver disorders, cardiovascular diseases, aur cancer diagnose karne mein madad karta hai.
- Laboratory errors, jo bhi human, instrumental, ya procedural reasons se ho sakte hain, galat diagnosis ya incorrect treatments ka reason ban sakte hain.
Sources of Laboratory Errors
Laboratory errors testing ke process ke kisi bhi phase mein ho sakte hain. In errors ko pre-analytical, analytical, aur post-analytical phases mein divide kiya jaa sakta hai. Har phase apni specific challenges aur errors ke sources present karta hai.
Pre-Analytical Errors
Pre-analytical errors woh errors hote hain jo sample laboratory tak pahuchne se pehle hote hain, aur yeh errors sabse common hote hain:
-
Incorrect Sample Collection:
-
Wrong sample type: Kuch tests ke liye specific types ke samples (e.g., serum, plasma, urine) chahiye hote hain. Agar galat sample type liya jaye toh results inaccurate ho sakte hain.
-
Incorrect volume: Agar sample ka volume zyada ho ya kam ho toh test results pe farq pad sakta hai.
-
Improper containers: Agar galat tubes ya containers use kiye jayein (e.g., EDTA ki jagah heparin), toh sample ki stability pe impact padta hai.
-
-
Sample Handling and Transport:
-
Temperature fluctuations: Agar sample ko galat temperature pe store kiya jaye (e.g., freezing ya overheating), toh analytes degrade ho sakte hain.
-
Prolonged transport times: Agar sample ko time pe deliver nahi kiya jaye, toh biochemical components alter ho sakte hain, jo results ko affect karte hain.
-
-
Patient-related Factors:
-
Fasting status: Kuch tests ke liye fasting (e.g., blood glucose) zaroori hoti hai, agar patient ne instructions follow nahi kiya toh results skewed ho sakte hain.
-
Medications: Kuch drugs, khaas taur pe vitamins ya anticoagulants, analytes ki concentration ko affect kar sakte hain.
-
Physical activity: Heavy exercise ke baad tests karne se electrolyte levels ya hormones mein changes aa sakte hain.
-
Analytical Errors
Analytical errors woh errors hote hain jo testing ke dauran hoti hain. Yeh errors instrumentation, methodology, aur personnel se related hote hain:
-
Instrumental Issues:
-
Malfunctioning equipment: Laboratory instruments agar sahi se kaam nahi kar rahe, toh incorrect results aa sakte hain (e.g., calibration problems, defective parts).
-
Poor calibration: Agar instruments regularly calibrate nahi kiye ja rahe hain, toh wo inaccurate results de sakte hain.
-
Inadequate maintenance: Agar equipment ka maintenance nahi hota, toh wo breakdown ho sakta hai, jo test results ko affect karega.
-
-
Reagents and Consumables:
-
Expired reagents: Agar expired reagents ya chemicals use kiye jayein, toh unke results inconsistent ho sakte hain. Reagents ko proper store karna aur expiry date ko regular check karna zaroori hai.
-
Contaminated reagents: Agar reagents contaminated hain, toh biochemical tests ke results unreliable ho sakte hain.
-
-
Human Error:
-
Operator mistakes: Yeh include karte hain galat sample handling, miscalculation of volumes, incorrect sample dilution, ya procedures follow na karna.
-
Failure to recognize interference: Kuch substances sample mein hoti hain (e.g., hemoglobin, bilirubin, lipids) jo assays mein interfere kar sakte hain aur false results de sakte hain. Agar yeh interference detect na ho, toh errors ho sakte hain.
-
-
Methodological Problems:
-
Assay limitations: Kuch assays ki limitations hoti hain, jaise narrow detection range ya poor specificity for certain analytes.
-
Method interference: Biological substances in the sample (e.g., hemolysis, icterus, lipemia) assays ko interfere kar sakti hain aur incorrect readings de sakti hain.
-
Post-Analytical Errors
Post-analytical errors testing ke baad hoti hain, jab results ko interpret ya report kiya jaata hai. Yeh errors kam common hote hain, lekin equally important hote hain:
-
Data Transcription and Reporting:
-
Clerical errors: Yeh errors jaise galat patient ID enter karna, misreporting results, ya transcription mistakes ho sakti hain, jo serious consequences la sakti hain.
-
Mismatched reports: Agar results galat patient ke saath mix ho jayein (mislabeling ya clerical mistakes ki wajah se), toh major misinterpretations ho sakti hain.
-
-
Delayed or Inaccurate Reporting:
-
Delayed reporting: Agar results time pe physician ko nahi diye jate, toh diagnosis aur treatment mein delay ho sakta hai.
-
Failure to contextualize results: Agar results ko clinical context ke bina interpret kiya jaye, toh galat conclusions ho sakte hain. Jaise elevated glucose levels ko diabetes ke indicator ke roop mein dekhna bina patient history ke.
-
-
Errors in Interpretation:
-
Lack of clinical correlation: Results ko hamesha patient ke medical history aur clinical condition ke context mein interpret karna chahiye. Agar yeh correlation na ho, toh results galat samjhe ja sakte hain.
-
Failure to recognize normal biological variability: Age, gender, ya time of day jaise factors results ko affect karte hain. In variations ko ignore karna interpretation ko galat bana sakta hai.
-
Quality Control
Quality control laboratory results ki accuracy aur reliability ko ensure karne ka ek system hai. QC ke zariye errors ko detect, reduce aur correct kiya jata hai, taki laboratory ke results consistent aur accurate ho. QC activities ka implementation internal QC, external QC, aur laboratory accreditation ke levels pe hota hai.
Internal Quality Control (IQC)
-
Control Materials:
-
Laboratories regularly control samples use karte hain, jinke known concentrations hote hain. Yeh samples patient ke samples ke saath run kiye jate hain. Agar results expected range se bahar jaate hain, toh kuch problem ho sakti hai.
-
-
Calibration:
-
Analytical instruments ka regular calibration ensure karta hai ki wo accurate readings de rahe hain. Calibration traceable standards se kiya jata hai aur agar discrepancies hain, toh unhe turant thik kiya jata hai.
-
-
Preventive Maintenance:
-
Laboratory equipment ka planned preventive maintenance schedule ensure karta hai ki unexpected breakdowns na ho. Yeh maintenance include karta hai cleaning, parts ko replace karna, aur instrument ki performance ko check karna.
-
-
Training and Competency of Personnel:
-
Continuous training ensure karti hai ki laboratory staff tests ko sahi tarike se perform kare aur results ko accurately interpret kare. Competency assessments aur periodic evaluations bhi ensure karte hain ki staff ke skills up to date hain.
-
-
Documentation and Standard Operating Procedures (SOPs):
-
SOPs har task ke liye detailed guidelines provide karte hain, jo consistency aur reliability ko ensure karte hain. Documentation errors aur deviations ko trace karne ke liye zaroori hai.
-
External Quality Assurance (EQA)
-
Proficiency Testing:
-
External proficiency testing programs mein unknown samples laboratories ko bheje jate hain. Laboratories in samples ko analyze karte hain aur apne results ko other laboratories ke results ke saath compare karte hain. Isse yeh ensure hota hai ki lab standards ko meet kar raha hai.
-
-
Inter-Laboratory Comparisons:
-
Laboratories ko apne results ko dusre laboratories ke saath exchange karne ka mauka milta hai, jo unhe discrepancies identify karne aur performance ko improve karne mein madad karta hai.
-
Accreditation and Regulatory Standards
-
ISO 15189:
-
Yeh international standard medical laboratories ke liye quality management requirements ko define karta hai. ISO 15189 accreditation ensure karta hai ki laboratory high standards meet karta hai.
-
-
Clinical Laboratory Improvement Amendments (CLIA):
-
CLIA ensures karta hai ki laboratory testing accurate, reliable aur timely ho. Laboratories ko specific guidelines follow karni padti hain related to equipment, staff qualifications, aur testing procedures.
-
Continuous Monitoring and Auditing
-
Internal Audits:
-
Regular internal audits laboratory processes aur results ko assess karte hain aur kisi bhi improvement area ko identify karte hain.
-
-
Corrective Actions:
-
Agar errors identify kiye jaate hain, toh corrective actions immediately liye jaate hain. Yeh actions ho sakte hain instrument recalibration, reagent replacement, ya staff retraining.
-
Quality control systems ke through, clinical biochemistry laboratories apne results ki accuracy aur reliability ko ensure karte hain, jo patient care aur treatment ko enhance karne mein madad karta hai.
Quality Control Charts
- Quality Control (QC) charts clinical biochemistry laboratories mein ek bohot important tool hote hain jo test results ki accuracy, precision, aur reliability ko monitor karte hain.
- Yeh charts laboratory processes ki stability aur consistency ko track karte hain aur agar koi error ya deviation hota hai toh usse identify karne mein madad karte hain.
- QC charts ka use kar ke laboratories apne test performance ko visualize kar sakte hain aur errors ko jaldi detect kar ke corrective actions le sakte hain.
- Clinical biochemistry mein, jahan test results directly diagnosis aur treatment ko affect karte hain, high-quality standards maintain karna bohot zaroori hota hai.
- QC charts ko use karke laboratories apne data ko track kar sakte hain, testing process ki performance ko monitor kar sakte hain, aur kisi bhi issue ko jaldi resolve kar sakte hain.
Types of Quality Control Charts
- Clinical laboratories mein kaafi types ke QC charts use kiye jaate hain, jo different aspects of analytical performance ko monitor karte hain.
- In charts ka goal yeh hota hai ke analytical process mein koi bhi shift, trend, ya abnormal variation identify ho sake.
- Neeche kuch commonly used QC charts diye gaye hain jo clinical biochemistry laboratories mein use hote hain:
Levey-Jennings Chart
Levey-Jennings chart sabse zyada use hone wala QC chart hai jo laboratory mein regularly use hota hai. Yeh chart quality control (QC) samples ke results ko time ke saath plot karta hai aur yeh dikhata hai ki testing process stable hai ya nahi. Yeh chart precision ko monitor karne ke liye useful hota hai.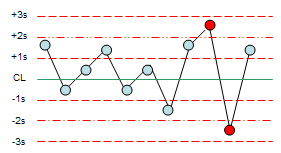
Features:
-
X-axis: Test runs ya time intervals ko represent karta hai (e.g., daily, weekly).
-
Y-axis: QC sample ke results ko represent karta hai (e.g., glucose level, cholesterol concentration).
-
Mean line (Average line): Yeh line target value ko represent karti hai jo QC sample ka expected result hota hai.
-
Control Limits (± 2 SD or ± 3 SD): Yeh statistical boundaries define karte hain ki test results kis range mein hone chahiye. Agar results in limits ke andar hain, toh wo acceptable hote hain, agar bahar hote hain, toh yeh potential issues ko indicate karte hain.
Interpretation:
-
Within Control Limits: Agar QC results ± 2 SD ya ± 3 SD ke range ke andar hain, toh system stable hai aur testing process under control hai.
-
Out of Control: Agar QC result control limits ke bahar jata hai, toh yeh indicate karta hai ki system out of control ho sakta hai. Iska matlab ho sakta hai ki instrument malfunction ho gaya ho ya reagents mein problem ho.
-
Trend Detection: Agar results ek direction mein consistently shift ho rahe hain (jaise hamesha high ya low ho rahe hain), toh yeh koi underlying issue ko indicate kar sakta hai, jaise reagent degradation ya instrument drift.
-
Random Errors: Agar results ek dusre se kaafi farq kar rahe hain bina kisi specific trend ke, toh yeh random errors ko show karta hai.
Example:
Agar ek laboratory cholesterol measure kar raha hai aur Levey-Jennings chart pe dekha jaye, toh ek month tak saare QC samples ± 2 SD ke andar hain, lekin ek point ± 3 SD ke bahar hai, jo ek potential issue ko indicate karta hai, aur laboratory ko investigate karna padega.
Cumulative Sum (CUSUM) Chart
Cumulative Sum (CUSUM) chart small shifts ya changes ko monitor karne ke liye use hota hai, jo Levey-Jennings chart pe easily detect nahi ho sakte. CUSUM chart deviations ko cumulative tarike se track karta hai, jisse process mein gradual shifts ko identify karna asaan ho jaata hai.
Features: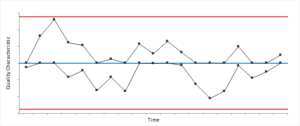
-
X-axis: Test runs ya time intervals ko represent karta hai.
-
Y-axis: Cumulative sum of deviations ko represent karta hai (observed result aur target value ke beech ka difference).
-
Control Limits: Upper aur lower control limits set kiye jaate hain jo deviations ko monitor karte hain.
Interpretation:
-
Trend Detection: Small shifts ko time ke sath accumulate kiya jaata hai. Agar chart mein gradual slope dikhayi de, toh yeh koi trend ya drift indicate karta hai.
-
Small Changes: CUSUM chart chhote, consistent shifts ko detect karne mein madad karta hai jo Levey-Jennings chart pe miss ho sakte hain.
-
Excessive Cumulative Deviation: Agar deviation ka slope suddenly increase ho jata hai, toh yeh major process change indicate karta hai aur corrective action ki zaroorat hoti hai.
Example:
Agar laboratory liver enzymes measure kar raha hai, aur CUSUM chart pe consistently small shifts dikhayi de rahi hain, jo individually control limits ke andar hain, toh yeh process mein gradual change ko indicate karta hai, jo corrective action ko require karta hai.
Western Electric Rules (WE Rules) Chart
Western Electric Rules (WE Rules) ek decision-making criteria ka set hai jo QC charts mein out-of-control situations ko identify karne ke liye use hota hai. Yeh rules Levey-Jennings charts ke saath use kiye jaate hain aur unko zyada precise decision making mein madad karte hain.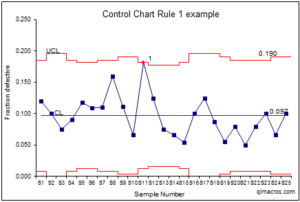
Features:
-
X-axis: Test runs ya time intervals ko represent karta hai.
-
Y-axis: QC sample results ko represent karta hai.
-
Decision Rules: Yeh rules pre-defined conditions provide karte hain jo batate hain jab corrective action ki zaroorat hoti hai.
Decision Rules:
-
Rule 1 (One Point Outside ± 3 SD): Agar ek QC result ± 3 SD ke bahar hota hai, toh system out of control hai.
-
Rule 2 (Two Consecutive Points Beyond ± 2 SD): Agar do consecutive QC results ± 2 SD ke bahar hain, toh yeh process mein shift ko indicate karta hai.
-
Rule 3 (Four Consecutive Points on One Side of the Mean): Agar 4 consecutive QC results mean ke ek side pe hain, toh yeh gradual shift ko indicate karta hai.
-
Rule 4 (Eight Consecutive Points Within ± 1 SD): Agar 8 consecutive results ± 1 SD ke andar hain, toh yeh precision ya variability ke issue ko indicate karta hai.
Example:
Agar laboratory Western Electric Rules ko Levey-Jennings chart ke saath use kar raha hai aur do consecutive QC results ± 2 SD ke bahar hain, toh yeh ek error ko indicate karta hai jo investigate karna zaroori hai.
Range (or Moving Range) Chart
Range (or Moving Range) Chart consecutive QC results ke beech ka variation monitor karta hai. Yeh chart especially useful hai jab laboratory ko precision ya test method ki stability ko track karna hota hai.
Features:
-
X-axis: Time ya test run sequence ko represent karta hai.
-
Y-axis: Consecutive QC results ke beech ka difference (moving range) ko represent karta hai.
-
Control Limits: Upper aur lower control limits jo variability ko monitor karte hain.
Interpretation:
-
Stable Process: Agar moving range control limits ke andar rehta hai, toh process stable hai aur consistent hai.
-
Excessive Variability: Agar moving range increase hota hai, toh yeh process mein increased variability ko indicate karta hai aur isse investigate karna zaroori hota hai.
-
Precision Monitoring: Yeh chart precision ko monitor karne mein madad karta hai jo high-accuracy tests ke liye zaroori hota hai, jaise blood glucose ya cholesterol testing.
Example:
Agar laboratory electrolytes measure kar raha hai, toh moving range chart detect kar sakta hai agar consecutive samples ke beech variability zyada ho rahi ho. Agar moving range zyada hota hai, toh equipment ko recalibrate karna ya procedure ko review karna zaroori ho sakta hai.
Process Behavior Chart (PBC)
Process Behavior Chart (PBC) Shewhart control chart ka ek variant hai jo testing process ki overall stability ko monitor karta hai. Yeh chart Levey-Jennings chart ki tarah hota hai lekin yeh gradually shift ya abrupt changes ko zyada focus karta hai.
Features:
-
X-axis: Time ya test run number.
-
Y-axis: QC test results ko represent karta hai.
-
Control Limits: Upper aur lower limits jo historical data par based hoti hain aur trends ya shifts ko identify karte hain.
Interpretation:
-
Stable Process: Agar results control limits ke andar hain, toh process stable hai aur laboratory confidently test kar sakta hai.
-
Trend Detection: Agar results rising ya falling trend mein hain, toh yeh process mein shift ko indicate karta hai. Agar process control limits ke bahar jata hai, toh corrective action lena zaroori hota hai.
-
Identification of Outliers: PBC abnormal data points ko identify karta hai jo expected results se kaafi different hote hain.
Example:
Agar laboratory kidney function test (e.g., serum creatinine) monitor kar raha hai, aur PBC pe dekha jaye, toh agar results gradually increase ho rahe hain, toh yeh system mein koi issue ko indicate karta hai jo corrective action ki zaroorat karta hai.